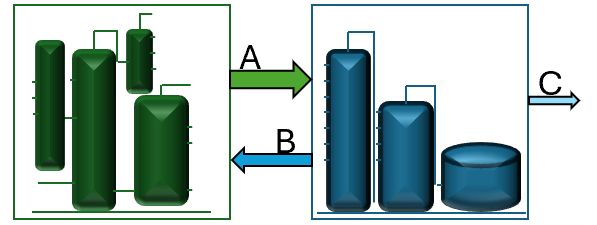
It is reasonably common in the oil refining sector to have production or supply arrangements with multiple participants. If you have an opportunity to send intermediate materials to other sites for further processing, how do you assess the economics of that situation so you can negotiate the optimal fee
The difference between refinery planning and scheduling may be obvious if you have worked in the commercial department, but from the outside the distinction is less clear. I usually explain that planning is about what you want to do while scheduling is deciding when you want to do it.

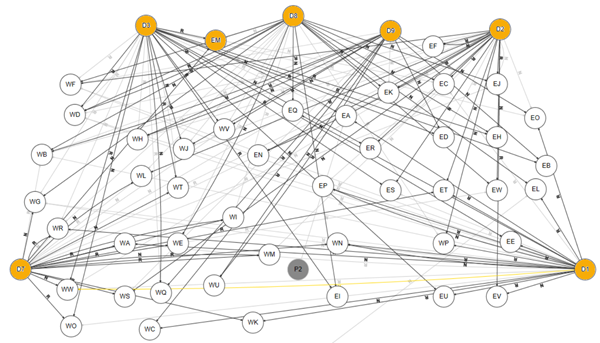
Although LP in the refinery business usually means a production planning model, it is also possible to apply optimization methods to product distribution problems - deciding which depot should supply each customer.

Emissions! How low can you go? Use an alternative objective function in your LP model to minimize emissions instead of costs.


You've been offered a new computer! What should you ask for?
We are often asked for computer hardware recommendations to reduce the time required to solve GRTMPS optimization problems. Let's answer the hardware question and throw in some additional suggestions that can reduce run times.
At our most recent user conference I was struck by how different the content felt to previous meetings. The agenda as always included material on the latest Haverly product developments, and best practices in the boiling-oil business, but that's definitely not all we are talking about these days...
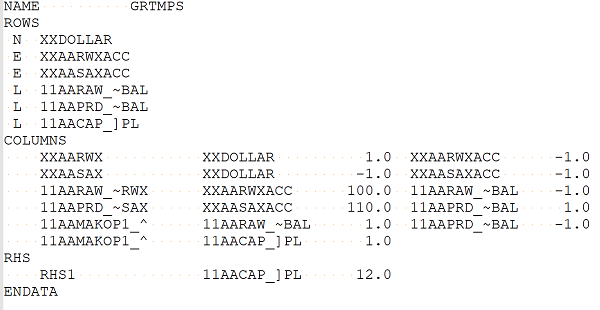
A client recently asked how to re-optimize the final matrix from an SLP model outside of GRTMPS. It's not hard if you know which files to save and remember a few DOS commands. Here are some instructions, in case anyone else is interested in going in through the back door and playing around inside the black box.
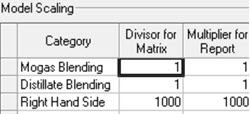
Refinery planning models are usually written with one underlying material balance basis – weight or volume – with one standard unit of measurement. Volume models, particularly in the US, are done in barrels, but it is common to find that the Hydrogen, and other gases, have been balanced in MSCF instead. Solids like Coke and Sulphur might be counted in tons. Why? Primarily, because that is how these materials are normally measured, so the values are more familiar and easier to interpret.
| Team | Played | Wins | Draws | Losses | Goals For | Goals Against | Points |
| A | 3 | 2 | 1 | 0 | 3 | 1 | 7 |
| B | 3 | 1 | 2 | 0 | 2 | 1 | 5 |
| C | 3 | 1 | 0 | 2 | 2 | 2 | 3 |
| D | 3 | 0 | 1 | 2 | 2 | 5 | 1 |
Group Results tables from the group stages of football tournaments make nifty logic puzzles. Knowing the Wins, Draws, Losses, Goals For and Goals Against, can you work out the scores of the individual games?
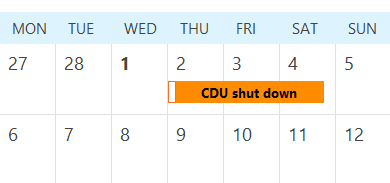
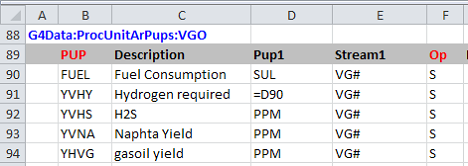
It can be very useful to give each process unit a special operation to represent on stream days to control availability and capacity, particularly when setting up cases with shutdowns.

Here is a trivia quiz for GRTMPS users and other LP and/or Excel aficionados. I’ve tried for a mix of obvious and obscure. Here is a chance to prove how clued up and erudite you are - or maybe to pick up some useful tidbits.
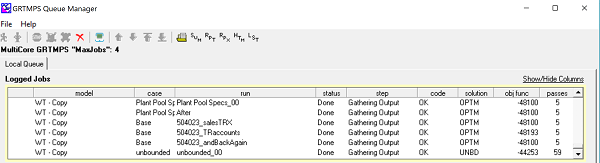
While the reports of individual optimizations can show us much of interest, most planning questions are answered by comparing the results of cases. With the Report Generator tool you can not only see numbers from multiple runs side by side, you can also create virtual cases which show the deltas between values.

If..then logic can be used in planning models to represent situations where an option can only be, or must be, active when a condition is met.
Tis the season....at least in Northern latitudes - for shorts, fans, lunch in the garden and summer vacations ... and to blend less butane into gasoline because the permitted maximum vapour pressure specification is lower when the weather is expected to be warmer. At least you probably won't have to worry as much about meeting cloud and pour on the diesel blending. How to handle these seasonal changes in specifications in your planning models?
I have previously described how distributed recursion solves the pooling problem (Desk Note #4) – focussing on it as an issue of quality balancing. I mentioned that this method does also have some mathematical underpinnings which I would write about later – and after being reminded by a reader --- here is an explanation of how distributed recursion can be derived from a Taylor expansion – and why the extra transformation that gives us distribution factors is useful for stable optimization.
Distribution planning models usually include targets for product quantities to be delivered reflecting commitments that have already been made. Customer N is due to receive X m3 of gasoline. Ideally, your refineries will be able to supply product to fulfill all the demands, but plans don’t always work out and you might find yourself having to manage a shortfall. Contracts sometimes include penalty clauses requiring compensation to be paid if all the contracted product is not delivered. These need to be represented in the model so it can give guidance in how to allocate the product that is available.
If you have multiple distillation towers at your refinery, you may find that the model allocates different crude slates to each. If operational constraints mean that crudes will be mixed in advance and run as a single feed, then the model is over-optimizing by directing them to the towers in different proportions. This is exactly the issue that is solved by pooling.
If you have multiple towers at your refinery, you may find that the model allocates different crude slates to each. If you have the flexibility to achieve that, then this is exactly the kind of solution you want. But if your operating options are more restricted and such plans cannot be implemented, the model is over-optimizing and you need to add some constraints on the blends to guide it to more realisitic plans.
The SSI system that is used to exchange data between model databases and Excel workbooks is useful for many tasks, and even more so when the additional capabilities of the Multi-SSI panel and the Workflow Tool for handling multiple imports are taken into account.
Process unit representations in planning models need to include capacity controls so that the optimization takes into account limits on how much material can be processed. The obvious and easy one to set up is a count of the feed.
Process vectors are usually written per unit of feed, so if you put a 1 as a loading factor on the capacity control and give the maximum, the unit has a size. Historically weight models were set up with weight-based limits because that was easy and linear but as it almost certain that physical constraints on the actual plant are volumetric flows, volume capacity controls would be more accurate.
Does your model have a lot of old clutter in it? Cleaning up your model can make it easier to understand, reduce its run time and improve stability. Unused pool qualities are a good de-cluttering target.
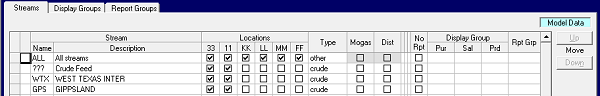
In GRTMPS you can define “generic” operations on distillation units that automatically expand for whichever set of crudes is available in the case. This is more convenient than having to write out operating modes for every crude. But if you have multiple towers or modes and some crudes that cannot be processed in all of them, you need to exclude those feeds from the expansion.
Planning models are usually run so that the optimization maximizes profit margin with no limits set on what can be spent to achieve it. But what if credit is tight? The global economy and political landscape have had quite a few upsets so far this century. For some companies that has certainly meant operating with limited access to finance. Feedstock evaluation changes from being an assessment of how valuable each option is to a question of what is the best combination that can be obtained for the money available.

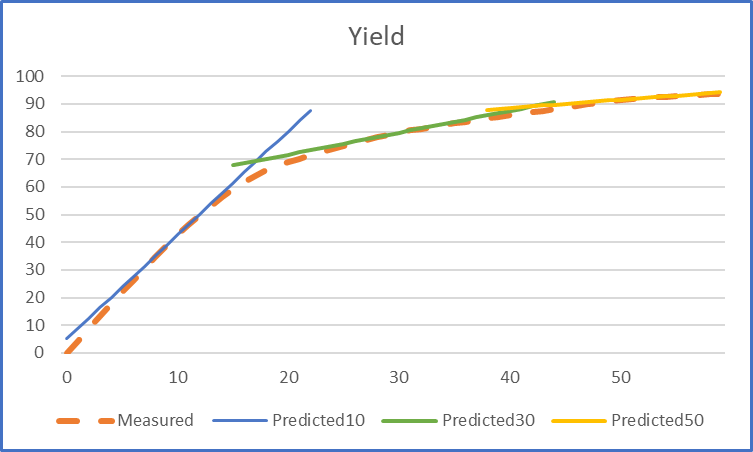
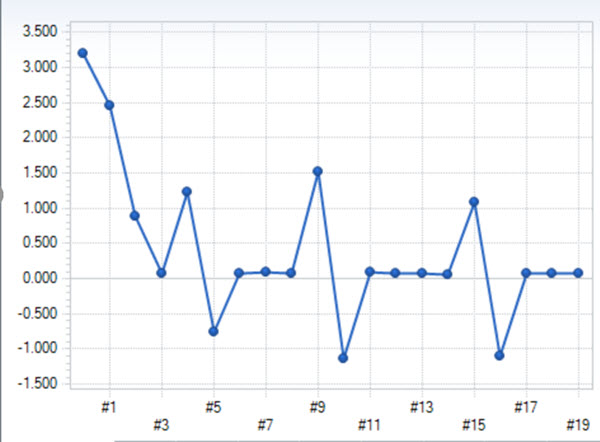
Crude oil evaluation is one of the most common optimization applications in the oil industry. The predicted profit margin/bbl for each grade relative to the others gives a “pecking order” of preferred feedstocks for a refinery. Even a difference of a few cents per barrel translates to a large sum of money, so it is very worrying when a crude that looked good drops from the top to the bottom of the list from one assessment to the next. Does it mean that the original evaluation was wrong?
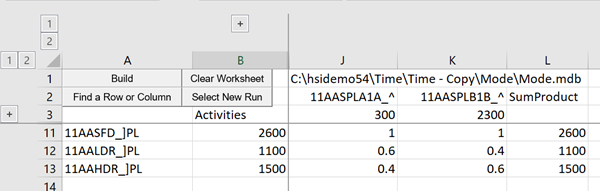
Help! My data is in rows, but I need columns. How can I get from:
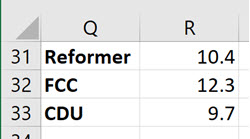 to
to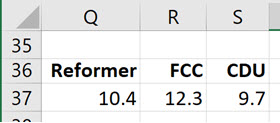 ?
?
Where in the reports you can see the margins on all the process units?
How does a planning model decide how much process unit capacity to use?
Have you ever right-clicked on a scroll bar?
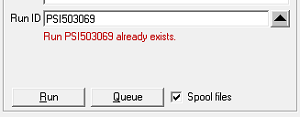
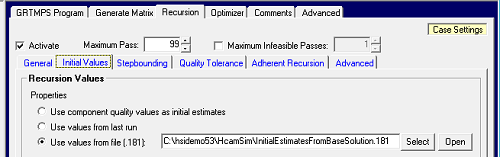
Case generator is a flexible tool for setting up loads of cases to go at the press of a button – and a 181 file of initial estimates can be very helpful in improving recursion behaviour. So how, asks a client, can I use one with the other?
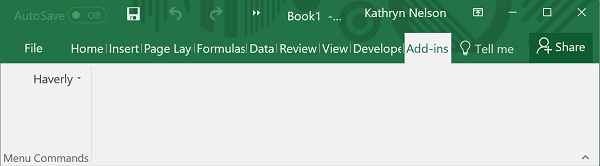
Spreadsheet or Database? Let’s be honest about our preferences. Given a pile of data to work with your first click will be the one that opens Excel. Databases are great for validation but they are lousy at maths so we in the GRTMPS team try to offer you the best of both – so you can use the input database to protect yourself from time wasting over undefined codes, but use a spreadsheet to manipulate data. The tool for passing data in and out of the model database via Excel is called SSI – for SpreadSheet Import.
What do cleaning a fish, climbing a mountain peak, and LP models have in common?


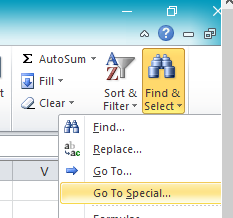
If you’ve ever wasted a few hours debugging a broken Excel workbook, then you will be as excited as I was when I learned about Go To Special last year. This does a lot of really interesting things, including finding all the cells in a worksheet with errors in them.

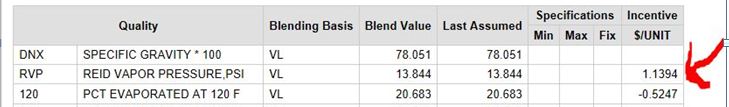
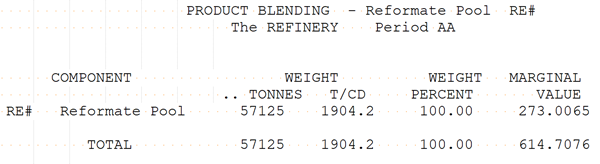
Have you ever wondered why pool qualities sometimes have marginal values, even when there is no specification?