An ideal feed rate for a process is where the value of the inputs that are being consumed is the same as the value of the outputs. If that balance point can be reached, then that is where the solution will end up. You can see which units have achieved that, and which have been constrained below it, on the Process Utilization report. Look at the maximum capacities and their expansion incentives --- which are the marginal values on the constraint equations under a different label.
Here is our WT demo model.
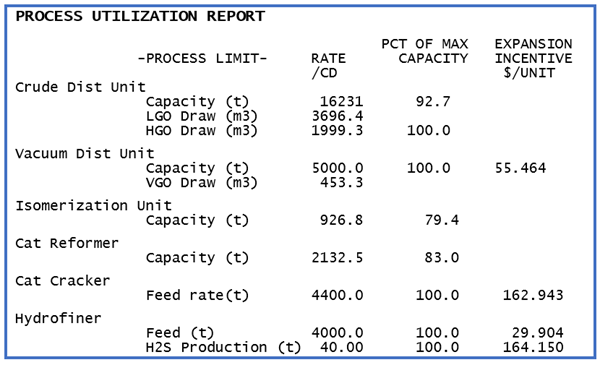
Any unit that stopped short of its maximum capacity (none have a minimum rate) is at one of these sweet spots. Its optimal. To process any more or less would lose money. Despite the bias in our industry to run units full, that is not always the most profitable thing to do. When margins are weak or changes in the market place - like new product specifications - make the economics of the processes rather different from what they were when they were built, reduced throughputs might be more profitable. There is no incentive to expand the capacity since there is already more than is needed.
Where a unit is at 100% of feed capacity, then the unit has been stopped short of the ideal rate. More feed would be processed if the limit could be relaxed. The incentive is an indication of the extra profit you could make for at least a small increase in capacity. (The HGO draw on the CDU looks like it might be an interesting oddity as it has no incentive even though it is reported as at 100%, but a quick check of the Solution Print reveals that it is actually Basic with a tiny bit of slack – so really 99.997% but that many decimals on the report would mostly just make it hard to read.)
Where do these incentives come from? The marginal value on the capacity reflects the difference between the marginal costs of the inputs and the marginal values of the outputs on the unit operations that are counted towards the limit. This can be confirmed by looking at the unit material balances. The isomerization unit is using only 79% of capacity. Its net marginal value should be zero.
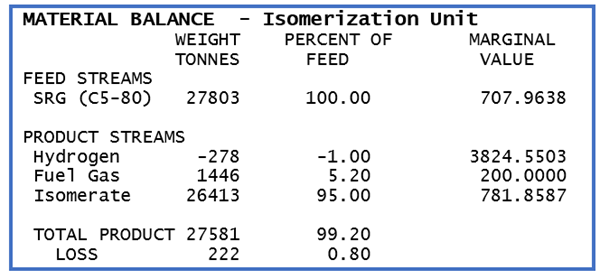
The marginal value of the Straight Run Gasoline feed is $707.96. Isomerate at $781 is clearly worth more, but Fuel Gas has a much lower value. Hydrogen has a high value, but it is actually an input that is modelled as an negative output (so that the operation can be scaled per unit of liquid feed) so that is going to reduce the value. Calculate the weighted average value to see the overall marginal product value: -.01 X 3824.55 + .052 X 200 + .95 * 781.86 = 714.92.
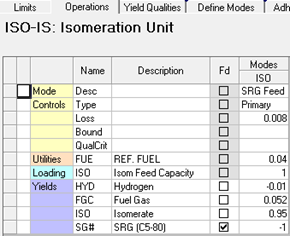
It looks like the unit should be running more, but there are still the costs of operating it to take into account. Each unit of production requires 0.04 units of energy.
|
Each tonne of isomerate requires 0.04 units of fuel energy Utilities have a balance row, just like streams, |
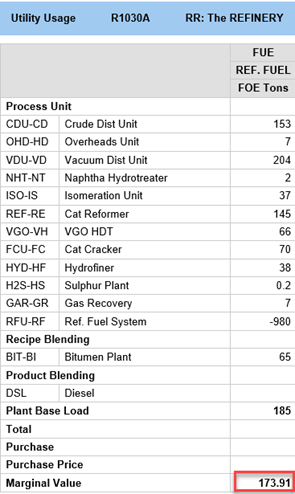 |
So net marginal value is 0 and there is no incentive to run any more (or less) feed.
The FCC, on the other hand, has an incentive at 100% of capacity so the marginal value of the outputs should be greater the marginal value of the inputs.
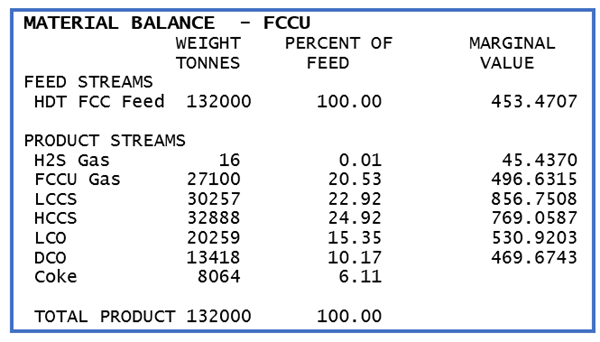
Calculate the weighted product marginal value. Coke has a marginal value of zero, by the way, because it is made and burned in a fixed ratio per tonne of feed in this simple unit representation. It can’t be optimized independently, so any extra, even if free, is of no use at all -- as the model represents the plant. Nonetheless, the value of the other materials works out at $619.24. This is $165.77 more than the feed marginal value, so the unit is definitely adding value. There is also a fuel consumption on this unit of 0.01594 FOE, that corresponds to a marginal cost of $2.77. Subtract that for a net marginal value of $162.99. Have a scroll back up to the Process Utilization Report and you will see that this is a number (with a little allowance for rounding, please) that we have seen before.
Does this always work? In one sense, yes because this is what the simplex algorithm is doing – balancing the marginal costs against the marginal benefits. However, these are not restricted to just materials and utilities/costs on the unit vector. For example, the Hydrofiner is hitting two constraints at the same time. The incentive on the main feed, includes an element of the marginal cost associated with the H2S bottleneck. There can also be relationships to other variables and limits. If the co-efficients that count the capacity used are themselves variable – for example if you saturate the control to indicate that less capacity is available under certain operating parameters so that is affected by severity, then any incentive on that severity can contribute. If you are counting volumes in a weight model, it is affected by anything that changes the feed density. With the non-linear process unit modelling system, you might also be using the capacity count to calculate some other part of the unit representation, for example having fuel consumption vary with throughput, so that there are other impacts associated with it. There is a way, of course, of seeing these other effects, which is to dig down into the mathematical level of the model and look at the matrix and the solution.
23rd July 2020.
You may also use this form to ask to be added to the distribution list so that you are notified via e-mail when new articles are posted.