At the start of this year's World Cupt, the puzzle setter in New Scientist magazine marked the start of the competition by reminding that Group Results tables make nifty logic puzzles. In the first stage each team plays a match against all the others in their group of 4. (In England we call this a “round robin” – I can see why the arrangement would make someone think of a circle – but where do the birds come in?). The results are summarized like so:
| Team | Played | Wins | Draws | Losses | Goals For | Goals Against | Points |
| A | 3 | 2 | 1 | 0 | 3 | 1 | 7 |
| B | 3 | 1 | 2 | 0 | 2 | 1 | 5 |
| C | 3 | 1 | 0 | 2 | 2 | 2 | 3 |
| D | 3 | 0 | 1 | 2 | 2 | 5 | 1 |
Knowing the Wins, Draws, Losses, Goals For and Goals Against, can you work out the scores of the individual games? (Stop here, and have a go now, if you want to do attempt this yourself first).
Logic
You can approach this as a logic problem. Enumerate the possible scores and eliminate those that don’t make sense. For example, starting with Team A - given their Goals For and Against, and that they had no Losses, their scores have to be in the set {0-0, 1-0, 2-0, 3-0, 1-1, 2-1, 3-1}. Team B also had no losses, so their game against A must have been a draw – either 0-0 or 1-1. Team C on the other hand, didn’t have any drawn games and only let in 2, reducing the set of possible scores for A vs. C to {1-0, 2-0, 2-1}. And so forth.
After a while, I found that I couldn’t work out any further eliminations, but I still didn’t know the scores. To continue it was necessary to arbitrarily choose an answer for one of the matches, and see if that lead to any contradictions. I have to confess that I ran out of patience and started to doubt that my previous deductions were all valid. You can get computer codes that will automate this process – a solution technique called Constraint Logic Programming – but I don’t happen to have one.
But I do have Linear Programming options to hand, so I decided to treat it as an optimization problem instead. (If you are good with a hammer, make your problem look like a nail.) Setting a value and seeing what sort of solution it gives you sounds rather like a Branch & Bound algorithm. Logic problems can be often be handled with Integer Programming (pure IP in this case, not MIP, as no linear variables in the mix). The possible scores are the variables and the results tables give you the constraints that have to be satisfied. The puzzle is only about finding a feasible solution, but optimization requires an objective function, so you need to introduce some sort of artificial cost to drive the solver – for example a fee for the total number of goals scored. It works quite neatly in GRTMPS – and you can also do it in EXCEL. (Stop here if you want to have a go – read on, if you need some hints.)
GRTMPS
In GRTMPS, start a model using File: New: Empty Model. This will give you a blank database with a single period and location. Since the limit values are all quite small, it is sensible to set the RHS scaling to 1. Either set the period duration to 1 or remember to mark all the limits as “unscaled”. The matrix generator code insists on having at least one stream that is active at the location and one cost account. Since I need an objective function of some sort, I decided that the model would buy Balls and sell Goals.
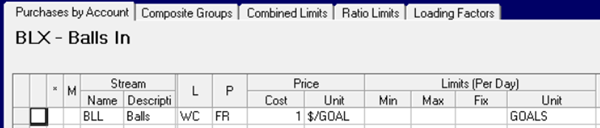
My Location is WC for “World Cup”, period FR for “Final Results”. A process unit converts Balls to Goals, which are then sold for $0.01. I made the Goals cheaper because I wanted to bias the solution to use as few Balls as possible.
A process unit is the easiest way to create variables and equations in GRTMPS. There are always many ways of formulating problems. It would be possible to write something that set a score and worked out who won and who loss with some If... Then logic, but that would have been unnecessarily complicated. Since there aren’t very many teams or goals, it's simpler to mimic the logical approach, using a binary variable for each possible outcome for each game. Each unit mode corresponds to a particular number of goals scored by each side, and who would be credited with a Win, Loss or Draw. This is like an old-fashioned linear modal process unit representation where each operation contains all the necessary detail, calculated prior to generating the model. Except that unlike trying to do this for an FCC or a reformer, we can actually include every possibility as there are a finite number.
The operations look like
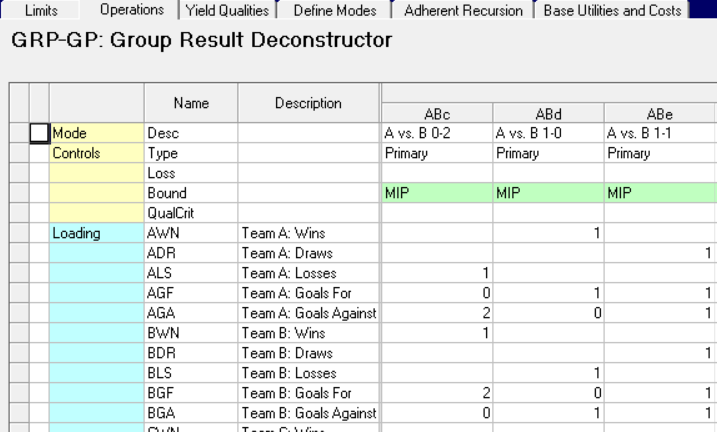
Mode ABc shows what is contributed to the results table if the game between A and B finished at 0-2. It would count as a Loss for Team A and a Win for Team B. A has 0 Goals For and 2 Goals Against – this is inverted for Team B. Mode ABd is a win for A, and ABe is a draw. Each mode is fed with “balls” and yields “goals” equal to the total number scored, so that the modes have some differences in economic impact. I used 67 modes in all for the 10 games. I took into account that Team A scored 3 goals, while the others had only 2. Otherwise, I included all the combinations of 0, 1 and 2 goals, even though I already knew that some of them could not possibly have happened. Leaving the optimization to weed them out makes good evidence that the model is working, and will make it easier to use the model for other results tables.
The Process Limits are used to tell the model what the final standings were.
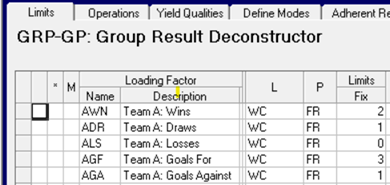
With the RHS scaling at 1 and period duration of 1, the limits will be exactly the numbers that you see. Marking them as unscaled on the Loading Factor definition panel (using TABLE 111.1) is another option.
There are also additional constraints to say that one score, and only one, must be chosen for each game. This is done by setting the sum of the activities for that subset of modes to 1. Because all the modes are binary variables, fixing the total to 1 means that only one can be active. You may recognize this as the logic that is imposed by having a Special Ordered Set, but setting it up explicitly is simple here, since the variables are all binary. It also means that the problem can be optimized with a more basic solver, such as our HS/LP – as used for the demo models.
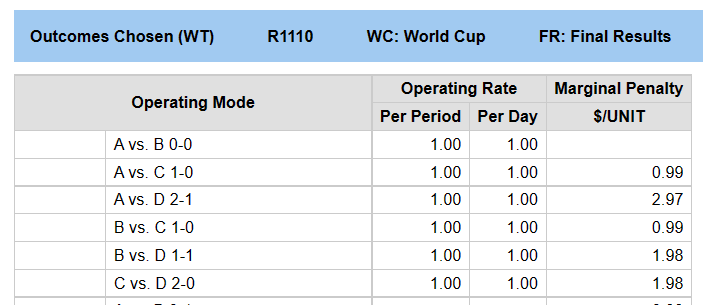
The report which best shows the solution is the Unit Operations (R1110) - with a custom title.
Excel
This problem can also be easily set up in Excel, using the Solver add-in to get an answer. I laid the problem out like a Matrix. There is a column of data for each of the 67 game-score possibilities. Row 6 has the variables that will be set to show the solution. Row 8 contains a cost to apply to each – simply equal to the number of goals scored in the game as Excel’s Solver also needs an objective value, but there is nothing to require streams or purchase/sales, so the operations don’t have any sort of material balance.
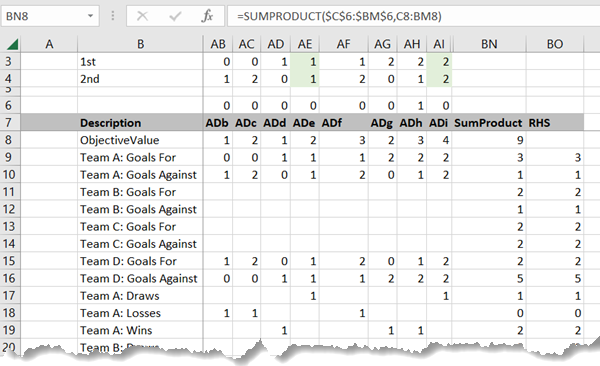
Column BN uses the SUMPRODUCT function to indicate the current value of each of the row counts. The problem can then be set up in the Solver dialogue as:
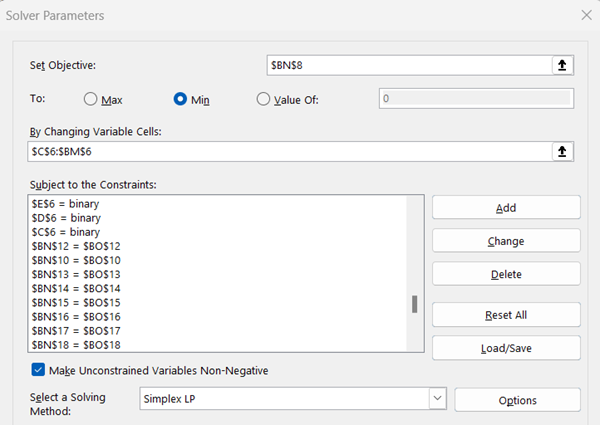
There is room to show only part of the Constraints list. I have scrolled it so you can see the end of the “=binary” part, a condition applied to each of the variables in row 6. The $BN$nn=$BO$nn ones that follow fix the totals of Wins, Draws, Losses etc. to be equal to the target amount. Note that you don’t have to enter all this via the dialogue. If you put in one of each type, you can use the Load/Save feature to put exemplars for the constraint definitions into the worksheet. Then use the standard Excel editing features to expand it and load the larger range back in.
Results
The results table used is Group C from the 2018 World Cup. I believe the puzzler chose it because it has the fewest goals scored of that year – and I didn’t update to the 2022 results because they all had more goals. It is only necessary to expand the number of Game-Score options to cover any additional possibilities. You need to go up to the smaller of the maxima of Goals For and Goals Against, as that gives you the most the could have been scored in any one game (which is why the current problem required scores only up to 3, and not 5). I decided that I should go do some real work, and didn't expand my model, but I suspect that with the larger numbers of goals, you would find that there are multiple answers. While every sets of scores determines a specific final table, there can be more than one combination that would give the same result.
What use is this? In a very distant future where all the digital information from this era has been lost because no one has the hardware to access acient, obsolete formats anymore, some scholar of sporting history might actually need to reconstruct tournament scores from fragmentary remains of results in a newspaper found at an archaeological dig, in which only the final tables are readable. Unlikely! The immediate benefit, of course, is the satisfaction of making the model work. However, it does illustrate a technique that can be applied to other problems where the options are all discrete and can be enumerated in advance. For example, if you have 7 ships arriving in a week to unload at 2 jetties, you could work out what each jetty assignment means for the availability of resources – how many days the jetty is blocked, which tanks are in use, – and then use the optimization model to find a combination that minimizes demurrage costs due to delays in docking and departures.
If you would like a copy of the GRTMPS model, or the Excel workbook, I would be happy to share.
From Kathy's Desk.
19th December 2022
19th December 2022
Comments and suggestions gratefully received via the usual e-mail addresses or here.
You may also use this form to ask to be added to the distribution list so that you are notified via e-mail when new articles are posted.
You may also use this form to ask to be added to the distribution list so that you are notified via e-mail when new articles are posted.