Have you ever tried to track a stream with multiple uses through a solution from complex model? If you use the standard reports, you have to jump around searching for the stream code and noting the amounts to work out the material balance. That’s all right occasionally but tedious if you have a lot of streams or cases to look at. The historic stream balance report (R1180) can do it, but its often spread out over several pages, so not that easy to read. There are some better options in the extended analysis tools, if you have a solution database for your run. (See Note # 26 Creating the Solution Database on Demand. )
The I+O Balance templates in Report Generator, do a fair job.
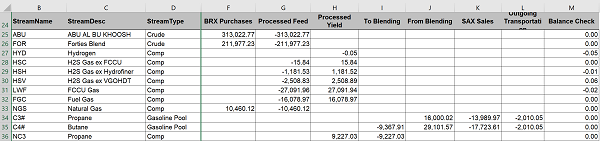
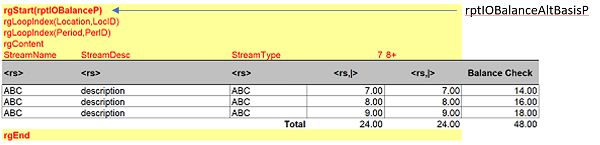
Here is the per period report from the weight demo model for the refinery location. There is a Per Day alternative. By default it retrieves the model basis quantities, so these are tonnes.
There is also a query for showing alternate basis (volume in a weight model, weight in a volume model) data. Just edit the rgStart command in the template.
This report is good for seeing the overall balance across a location as it gives you all the streams but the groupings are rather broad. You can see that some of the butane (C4#) was used in blending, but not which products it went into. That some was transported out, but not where it went.
| For more detail I really like the new Solution Block Diagram tool that was released with v5.4 in 2017. This shows you how a stream is made and used, and allows you to drill down into reports. As when opening any of the Tools, the quickest way to load the solution you want to see is to put your cursor on that run in the output tree, then launch it from the menu (although you can of course use File on the SBD menu ribbon to select a model, case and run if you don't open with the right one). | 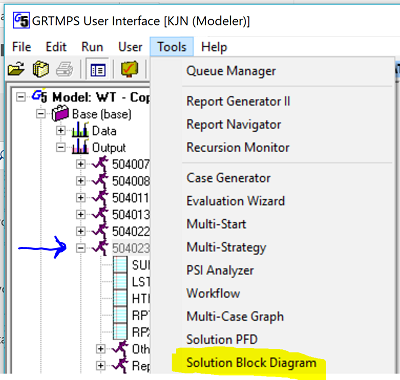 |
This is the main menu for the Solution Block Diagram. On the left are tabs to indicate which location and period AA are currently displayed. The first column also shows the current location, and lists the others so that you can select them. If there are multiple periods, you can click on the Periods tab to switch the selection column to time periods. The main block shows the various elements of the model. You can use the “Show Only” section and the “filter” box to reduce the number of items displayed and make it easier to find a particular thing.
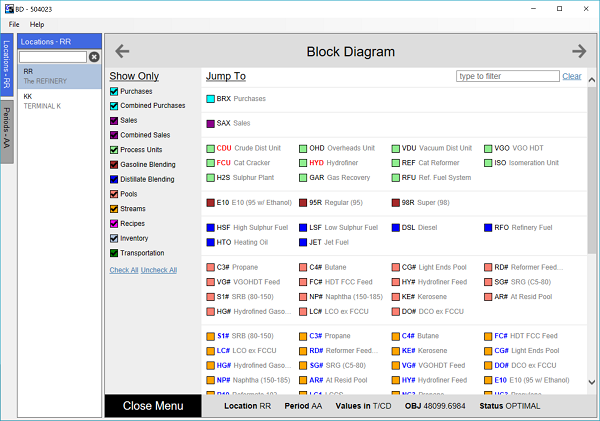
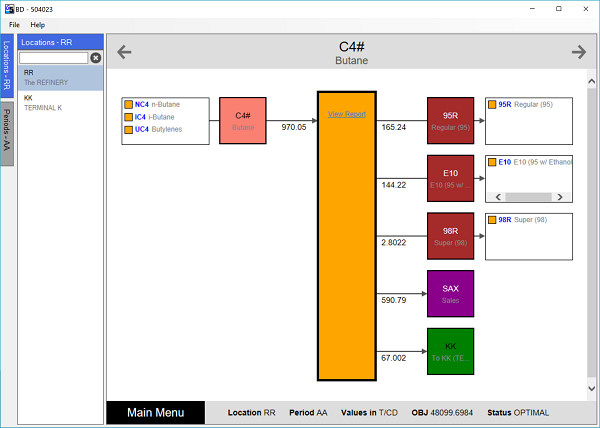
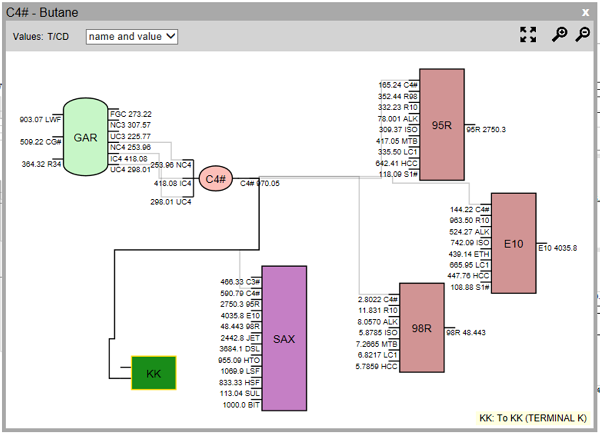
There is an orange button for every material in the Streams section. Click on it to see a simple flow diagram of the sources and disposals. Here is a more detailed balance for the butane pool where we can see the amount going to each product as well as the transport destination. The values displayed are always model basis, per day.
|
The orange rectangle at the centre represents the butane stream.
|
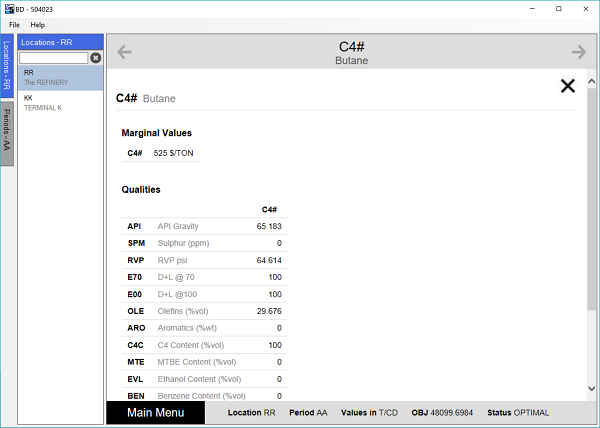
Click on View Report to see the marginal value and stream qualities. |
 |
 |
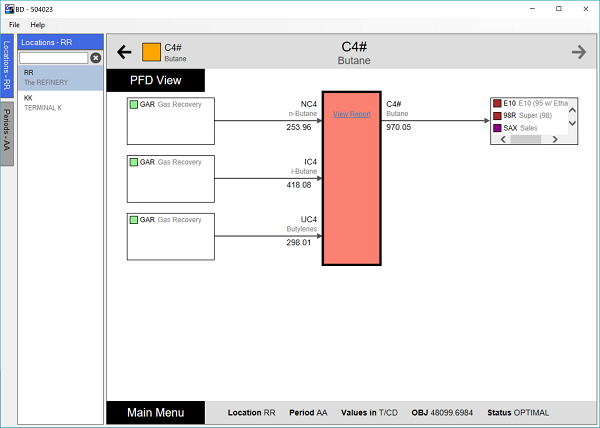
If the stream you are tracking is a blended product or a pool, it also appeared on the main menu in the brown Gasoline Blending list, blue Distillate Blending list or pink-ish (salmon, coral?) Pools section. If you chose the code in that section, you would have entered the flow diagram at the blending point.
|
You can also arrive there from this stream balance screen by clicking on the pink box on the left that represents C4# as a pool
|
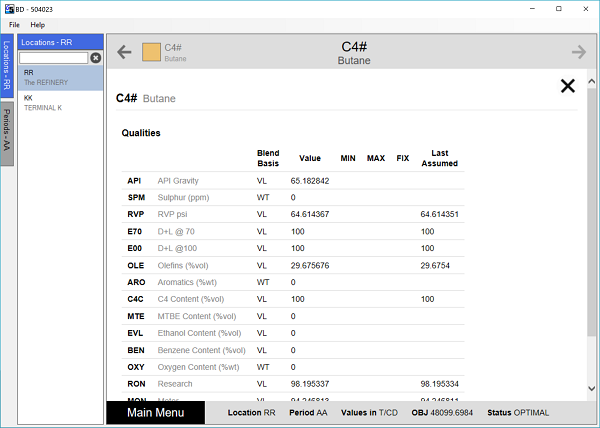
This time the report shows the specification as well as the stream properties. |
 |
 |
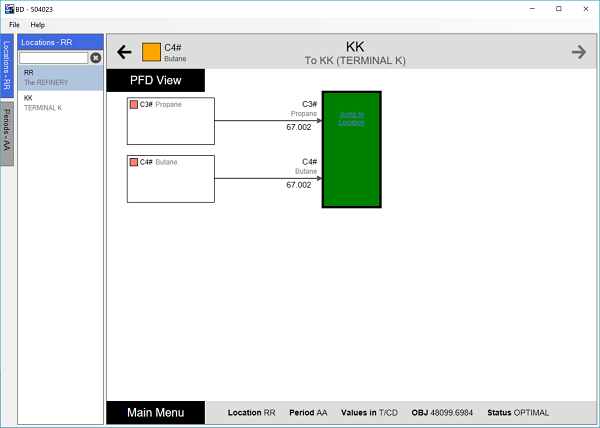
To investigate any other part of the balance in more detail you can click on the coloured boxes, both in the main picture and the smaller ones in the sub-sets that list the stream codes on the boundaries of this flow. For example, if you return focus to Butane as a stream (upper left, back arrow and orange box) and click on the green box for “KK”, you can see what other streams are transported there. On this node, if you click on the green rectangle, where it says “Jump to Location”, you can switch to the KK diagram and follow the destination of the transported streams there.
 |
Why do I like this tool so much? The information is clear and simply presented. I can see enough to understand what is going on without being overwhelmed by detail.
However, if you do want a more connected, bigger picture, or you haven’t upgraded to 5.4 yet, then you can use the older “Solution PFD” tool that was released with 5.1 (2014). This will automatically draw a process flow diagram of everything at one location, like so:
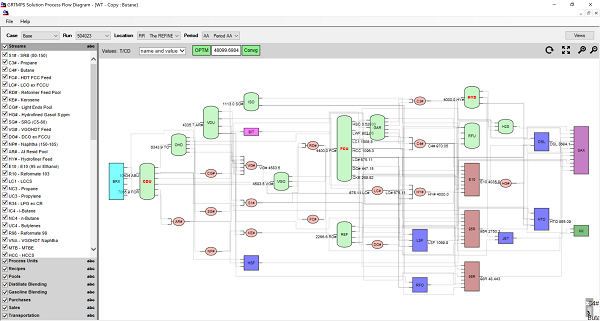
I think you will agree with me that unless you have a very large screen, there is just too much here to see clearly, at least with my eye-sight. Fortunately, you can right-click on any object and open a mini-view. This will centre on just that one unit or stream. The default drawing tends to set things up in a column, so do some dragging and dropping to make better use of the width of the window space, followed by hitting the "Route" then “Fit to Window” buttons, to achieve a more useful picture. I can now see not only how the butane pool is made and used, but also other streams that are travelling along with it.
These alternative views can be saved and used for other runs within the same model.
Why is it so useful to know where a stream is going? Of course, you need to confirm that you have a good material balance, but it will also help you to understand the economics. The optimization will minimize production costs and maximize disposal profits. Where there are constraints, the stream marginal value will reflect the next best thing to do, so its a good idea to know what the options are.
Thanks to Eric for developing these useful solution displays. Please let us know if you have any suggestions for improvements. If you have used them to good effect, you could give a short paper about it at the next conference!
From Kathy's Desk, 8th January 2018.
Comments and suggestions gratefully received via the usual e-mail addresses or here.
You may also use this form to ask to be added to the distribution list so that you are notified via e-mail when new articles are posted.