That sort of margin information does NOT fall naturally out of an LP solution. The objective value of the optimization gives you the overall margin for everything that is represented in the model but there is no allocation to particular units or activities or locations. The optimization calculates and is driven by the incremental, marginal values (technically shadow prices, which are like a marginal value but for columns, including the slack columns that indicate if a row is constraining or not). The overall value contribution of a particular resource or set of streams isn't accumulated as the solver moves along, only how the economics would change if you could do more or less.
There is obviously some relationship between a process unit’s margin and the marginal value of its capacity. Indeed, it is tempting to use the marginal value on a process unit’s main capacity as the answer to a question about its margin. Here is an extract from the process utilization report for one of our demo models.
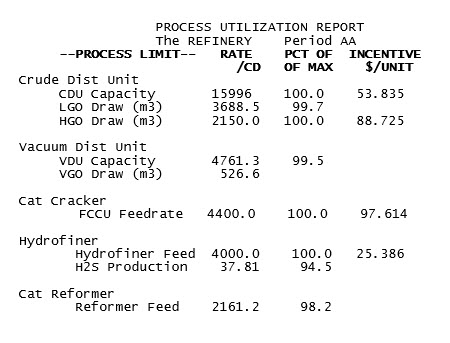
Why not say that the Hydrofiner is giving you $25.39/t of feed? We have seen how that value is related to the increase in stream value over the unit – at least in this simple situation where there is one limiting capacity on throughput. That gives you some justification for using this value, as it must apply to at least some of the feed, even though the marginal value will change when the capacity is increased (reduced) enough to be constrained by (become slack on) another limit. Multiply it by the tons per day and you have an estimate of the unit margin.
But what about the CDU which is constrained by two limits? In this situation the marginal value on the overall capacity also includes an element of the cost on the other limit. How should that be taken into account when estimating the unit margin? The analysis would certainly be simpler if there was just one incentive to use. An easy way to get a single overall marginal value even on a more complex unit is to use a block operation structure with a variable representing on-stream days to generate capacity. The separation of availability from flow rate has many benefits (see GRTMPS Tech Note HTN-0005) that I will write about some other time, but relevant here is that it gives you a marginal value on days of operation.
If a process unit is not already configured this way, setting it up can be very simple. You need a limit to control the time.
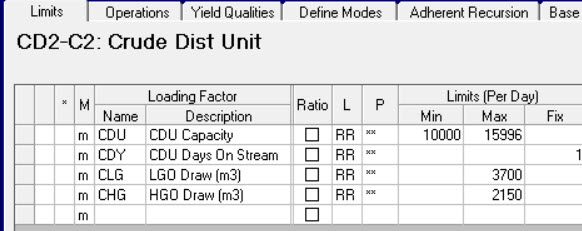
This is will be set to a FIX of 1 day/day if you insist that the unit operate, or make it a MAX limit if the unit could be shutdown during the planning period. (If, by the way, your process limits are normally given in ‘000s then this limit would be set to 0.001 kilo-days per day).
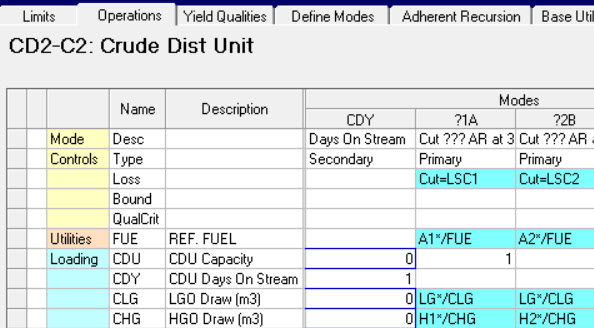
The process unit has an additional mode to set the time. (A convenient place to model daily costs and utility consumptions). This loads into the days-on-stream limit and is connected to the other capacities with a special place holder, like so, where I have added it to the CDU:
I added time controls to several of the units in the WT demo model and ran it again. The problem is mathematically equivalent and the optimization converged on the same solution. (The forces of chaos don't usually interfere with this model). Now we have some rather larger scale incentives indicating the incentive to run another day.
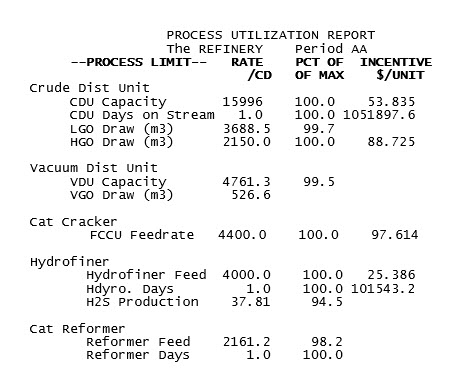
Divide the one on the Hydrofiner on stream days by the throughput per day. See? This indicates that the capacity marginal value applies to at least a day’s worth of production. The value on the CDU when divided by the throughput comes out between the two capacity incentives – indicating that there is some contribution from both to the overall value that the unit provides. This value probably doesn't apply to every bit of crude that is going through the unit, but it does give us a plausible estimate for the unit margin.
But what about the reformer? The marginal value is zero on both the throughput limit and the on-stream control because there is more capacity than required. This does not mean, however, that the unit is contributing zero to your profit margin. There is no incentive to build a larger unit, but if a unit is running (above any minimum), then it is doing so because it is making money.
How to get a margin for a unit with no marginal value? You could change the upper limit on capacity so that it becomes constraining. This new value, of course, has to be below, not at, the optimal rate so that there is an incentive to do more, but by how much? To see how the limit level affects the value, do a sensitivity study on it.
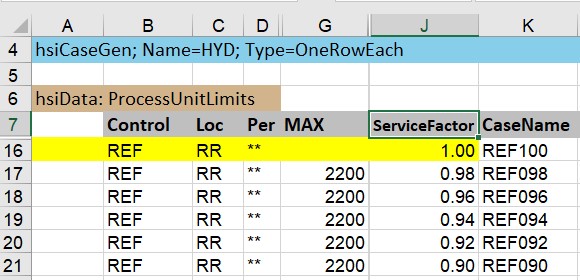
This is the new database SSI-style input for the Case Generator that was released with 5.6 SP2 (You can, of course, still use the original OMNI Table method). I’m varying the service factor, rather than the limit itself, so that the scale of the change is the same on any unit I apply it too. On a unit with multiple limits, like the CDU, you have to be sure to apply the same factor to all the feed and rundown capacities in order to keep the unit in balance. Unless, of course, there is an on-stream-days control, in which case a service factor there will take care of all the capacities, which is another benefit of that design.
This gives me a range of MVs (Use the MC_ProcessUtilization template from the Report Generator to collect the values.)
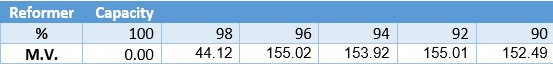
Reducing the capacity to 98% when the optimal is 98.2% only moves the solution a small distance from the zero marginal value point. At that point, the unit doesn’t look to be making much of a contribution. But when a larger reduction is made, there is reasonably large range where the values are fairly similar, so we could perhaps take the minimum value of these as a conservative estimate. Why not just turn the reformer off altogether, you ask? That would give you a value for the whole unit rather than requiring you to extrapolate. Since there is only one and it is critical for making hydrogen for de-sulphurization, it is unlikely to be a feasible scenario. I would need to provide an alternative source of hydrogen and possibly also alternative disposals for the feed streams. Clearly the costs and magnitudes of the options you add to make a feasible situation will have an impact on the objective value, and therefore the apparent margin of the unit. So, unless you know that the refinery can run relatively normally without the unit or are specifically doing disaster planning or studying unit shut down, this is probably too extreme to give you value for normal operations. With the on-stream days structure, you can make the adjustment on the available time instead of the capacity. This simulates the unit as running within normal min/max flows when available, but not operating every day. If your unit has multiple operating blocks or flow rates are used as inputs to non-linear co-efficient calculations, this will give you a more accurate representation.
It always a good idea when inferring a value to try a couple of different approaches. Consistency gives us a measure of validation, while inconsistency in what appear to be equally plausible methods (Hubble constant value?) are a challenge to the standard model. Reducing the capacity reduced the objective function. We can get an alternative estimate for the unit margin by valuing the capacity at the average loss per ton of feed.
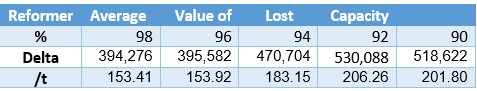
I quite like this approach, even though more runs are required. Not only does it take more into account that not all the capacity has the same incremental value, it also allows the system to rebalance itself. A marginal value assumes everything else stays the same as it was in the last matrix. When the problem is re-optimized and the non-linear elements are updated until there is a converged solution with consistent quality balances, the impact on profits might be more or less than the extrapolation from the linear approximation. This also gives you a uniform approach to apply to all units, whether they are running at full capacity or not.
Were you expecting a linear relationship between capacity available and margin/marginal value? While predictions of value are roughly increasing as capacity declines and it becomes harder and harder to run the refinery, it is not a smooth relationship. Your first thought may well be that this is evidence of local optima problems, but it could also be geniunely due to the non-linear relationships in the model. To tease these apart I should do a multi-start on each case to see if the solver, working from different initial estimates, will find a solution with a higher objective value from among all the possible feasible answers to the non-linear problem. Although this is even more runs, with multi-core I could finish them off quite quickly. If it was something I did reguarly I would also automate it with a little WorkFlow so I could run the whole thing with a single click... but I think I will keep that for a later instalment.
28th Sept 2020.
You may also use this form to ask to be added to the distribution list so that you are notified via e-mail when new articles are posted.